Bierzemy udział w globalnych działaniach na rzecz zrównoważonego rozwoju. W globalnej działalności naszej firmy pracujemy nad ograniczeniem emisji dwutlenku węgla i zużycia energii, szczególnie w kwestiach podróży i zużycia energii w naszych biurach. Jest to zgodne z globalnymi wysiłkami na rzecz osiągnięcia celów Paryskiego Porozumienia Klimatycznego 2015 r. i Celów Zrównoważonego Rozwoju ONZ.

Metodologia ustalania śladu węglowego
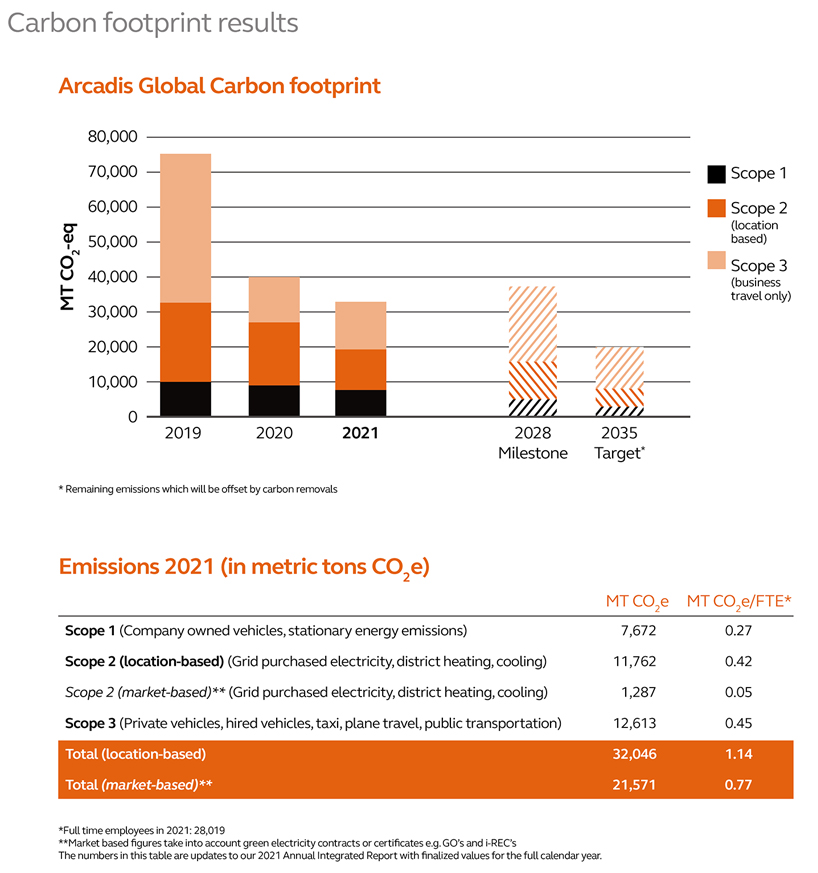
Głównym czynnikiem wpływającym na nasze zużycie energii i emisję dwutlenku węgla są podróże naszych pracowników, którzy spotykają się z klientami i pracują nad projektami. Jesteśmy również firmą z ponad 350 biurami, więc nasze zużycie energii w tych przestrzeniach jest ważnym przedmiotem działania. Od 2010 roku stosujemy standaryzowane podejście do raportowania danych zgodnie z protokołem GRP (General Reporting Protocol) organizacji World Resources Institute. W dalszym ciągu dokładamy starań, by poznać pełen wpływ naszych działań na bezpośrednie i pośrednie emisje gazów cieplarnianych, zużycie energii i środowisko. Poniższa tabela przedstawia postępy, jakie poczyniliśmy.
W 2020 r. biura Arcadis na całym świecie zużyły 167 955 kg papieru. Z tego 34% było opatrzone certyfikatem zrównoważonego rozwoju Rady ds. Odpowiedzialnej Gospodarki Leśnej.
Nasz Zespół główny ds. zrównoważonego rozwoju nadal odgrywa kluczową rolę w gromadzeniu danych, sprawozdawczości i udostępnianiu najlepszych praktyk. W dalszym ciągu wdrażamy zintegrowany europejski system zarządzania energią ISO 50001 i system zarządzania kwestiami środowiskowymi ISO 14001.
Dowiedz się więcej o projekcie
Mamy nadzieję, że spodobała Ci się ta historia. Z przyjemnością skontaktujemy się z Tobą i porozmawiamy o tym, jak możemy polepszyć jakość życia w Twoim biznesie.